About me

Hi! I am Joana Sánchez and I am a self-taught Data Analyst with experience in SQL, Tableau, Python, R and Excel.
In March 2022, I decided that I wanted get into Data Analytics with zero experience whatsoever. My professional background is in Education and Textile Design.
I have taken certificates such as Google Data Analytics Certificate, courses in Udemy and Coursera in SQL, Excel
and Tableau. But what really helped me has been to practice my knowledge and make my Portfolio Projects
that I will be posting in this webpage.
I am from Mexico, lived in Stockholm, Sweden the last 5 years and now I live in Los Angeles.
I speak three languages Spanish, English and Swedish and I am an extremely fast learner willing to learn more about analytics.
💡 Skills:
Excel, Google Sheets, Python, SQL (PostgreSQL, Oracle, Microsoft SQL Server),
Tableau, Adobe Photoshop, InDesign, Illustrator, Lightroom, Visual Studio Code.
Projects TABLEAU
 All projects on Tableau HERE
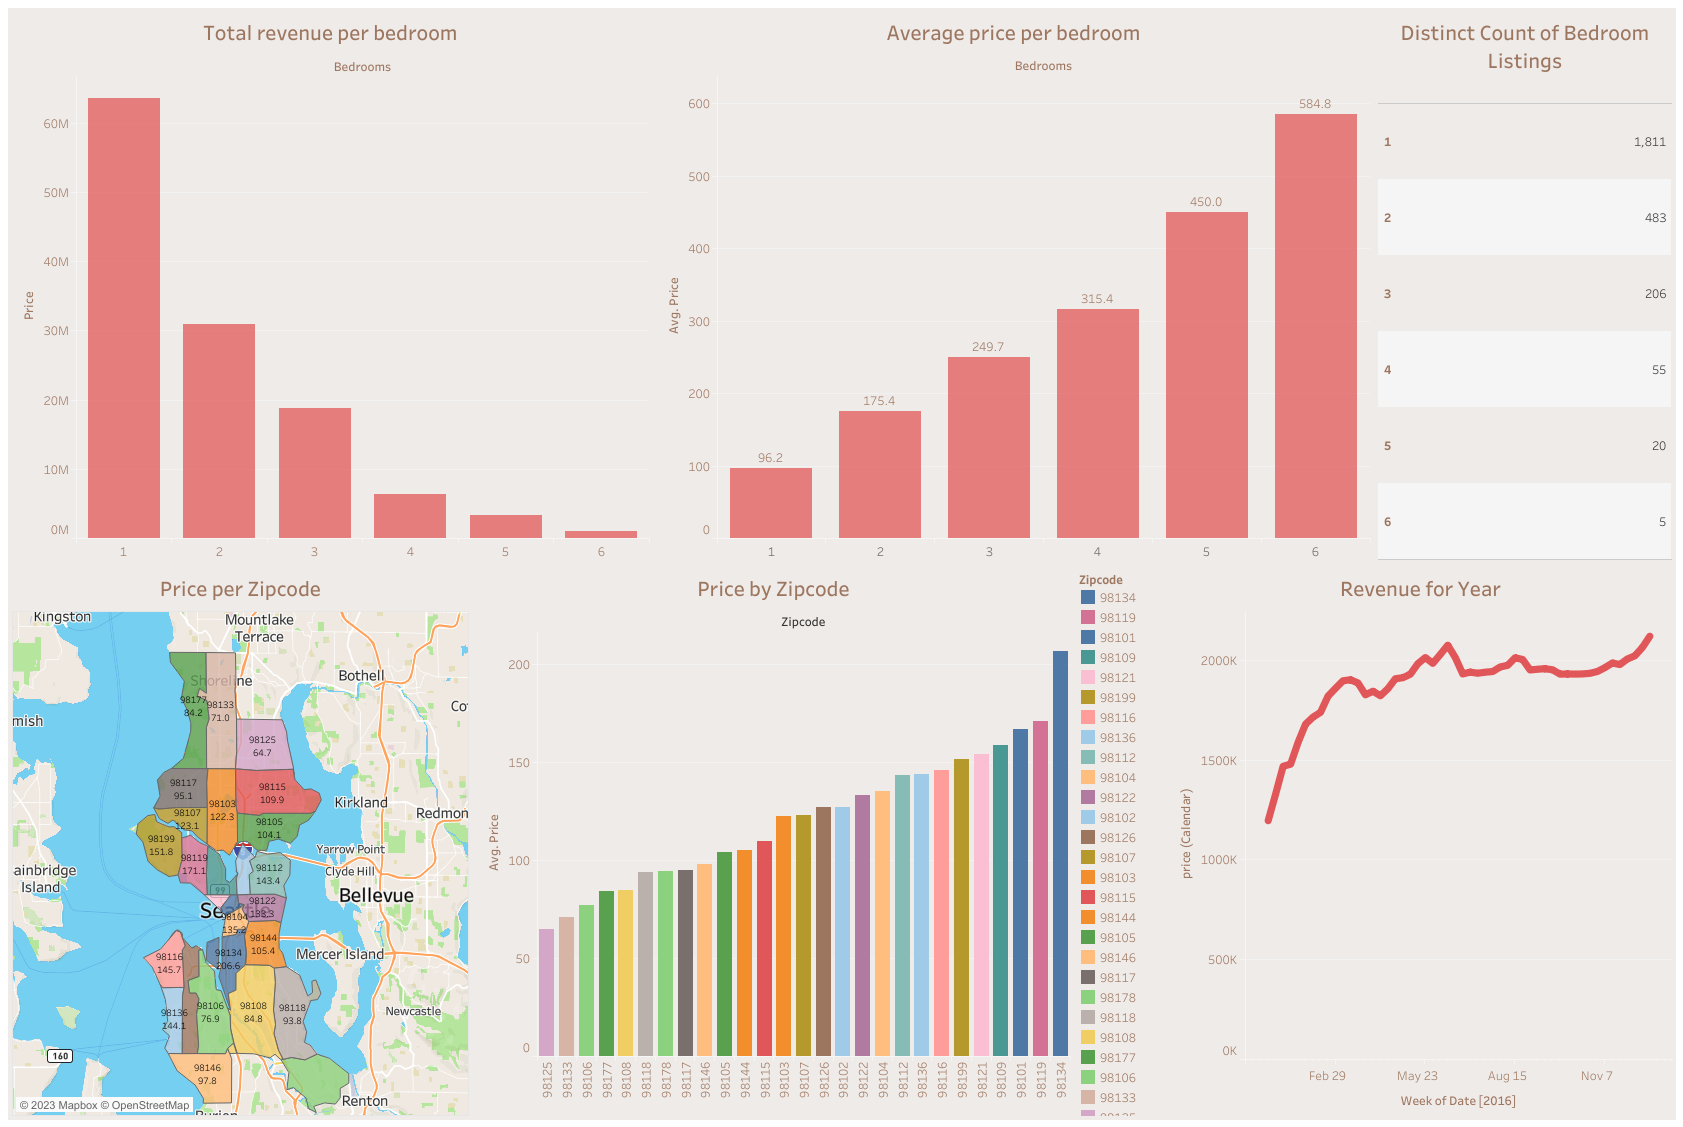
Airbn Seattle
Analysis on Airbnb revenue in Seattle year 2016. The analysis include average price of property according to the Zipcode, revenue by year of all the properties on Airbnb, listings of properties with 1-6 bedrooms, as well as the average price per bedroom and total revenue per bedroom.
The goal of the analysis is to show which kind of property, how many bedrooms, and in which area, has the most revenue.
Tools: Excel, Tableau
Project on Tableau HERE
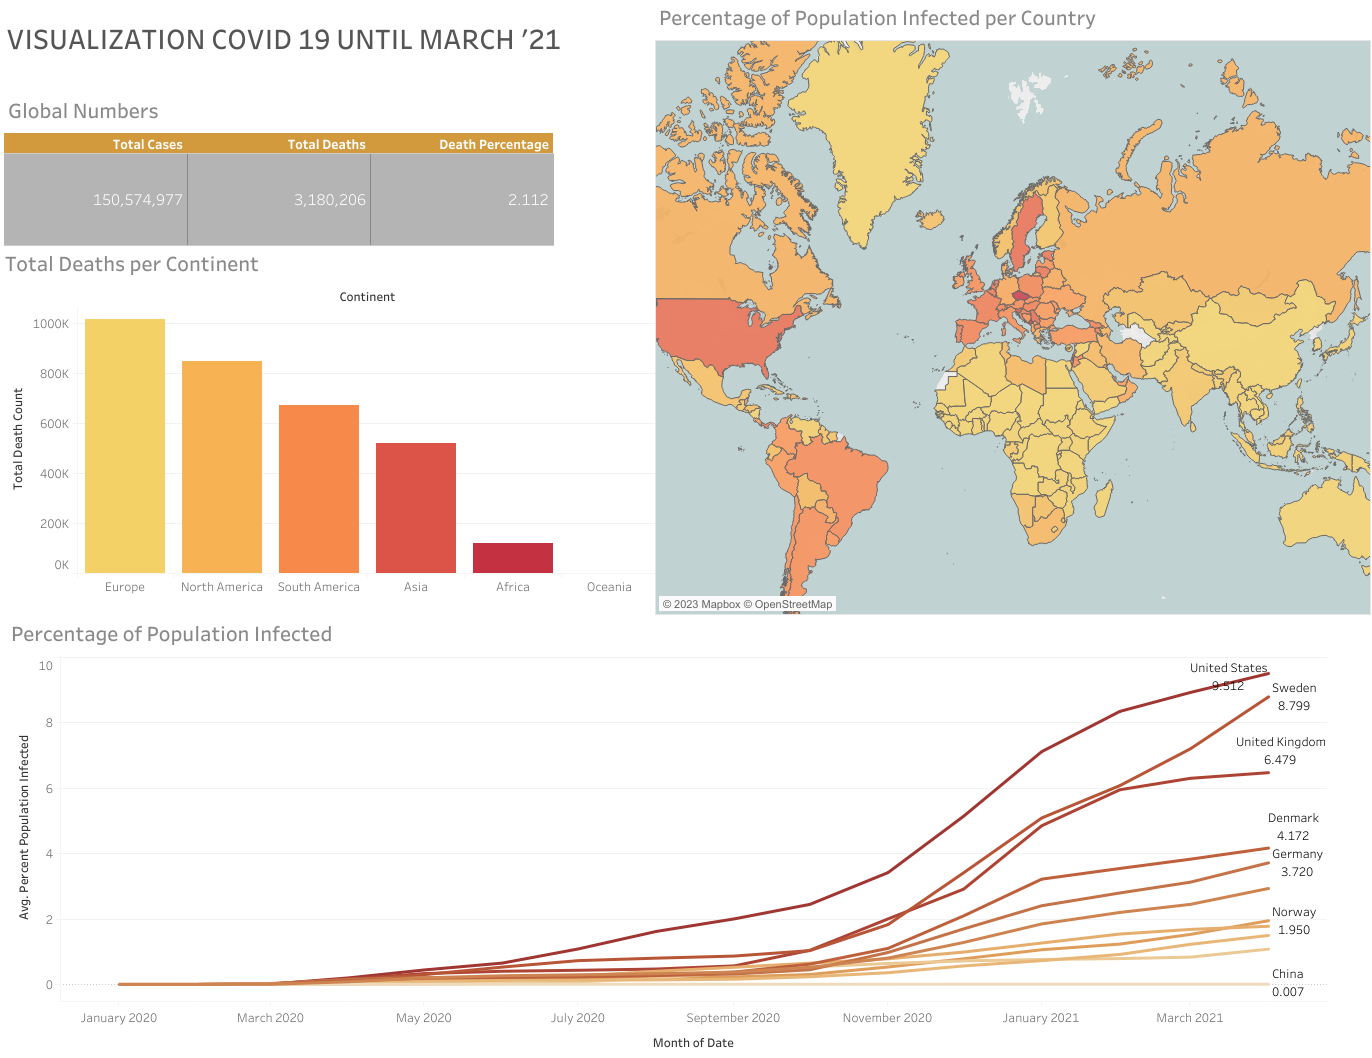
Covid-19 Analysis
Analysis on covid-19 from the beginning until March'21. This dataset focuses on deaths, vaccinations and specific countries such as United States, Sweden and Mexico.
Tools: Excel, Sql, Tableau
Project on Tableau HERE
Most sold video-games globally
Analysis on the Top 43 most sold video games softwares. This dataset shows sales, years, publishers, developers, among other information.
Tools: Excel, Sql, Tableau
Project on Tableau HERE
.png)
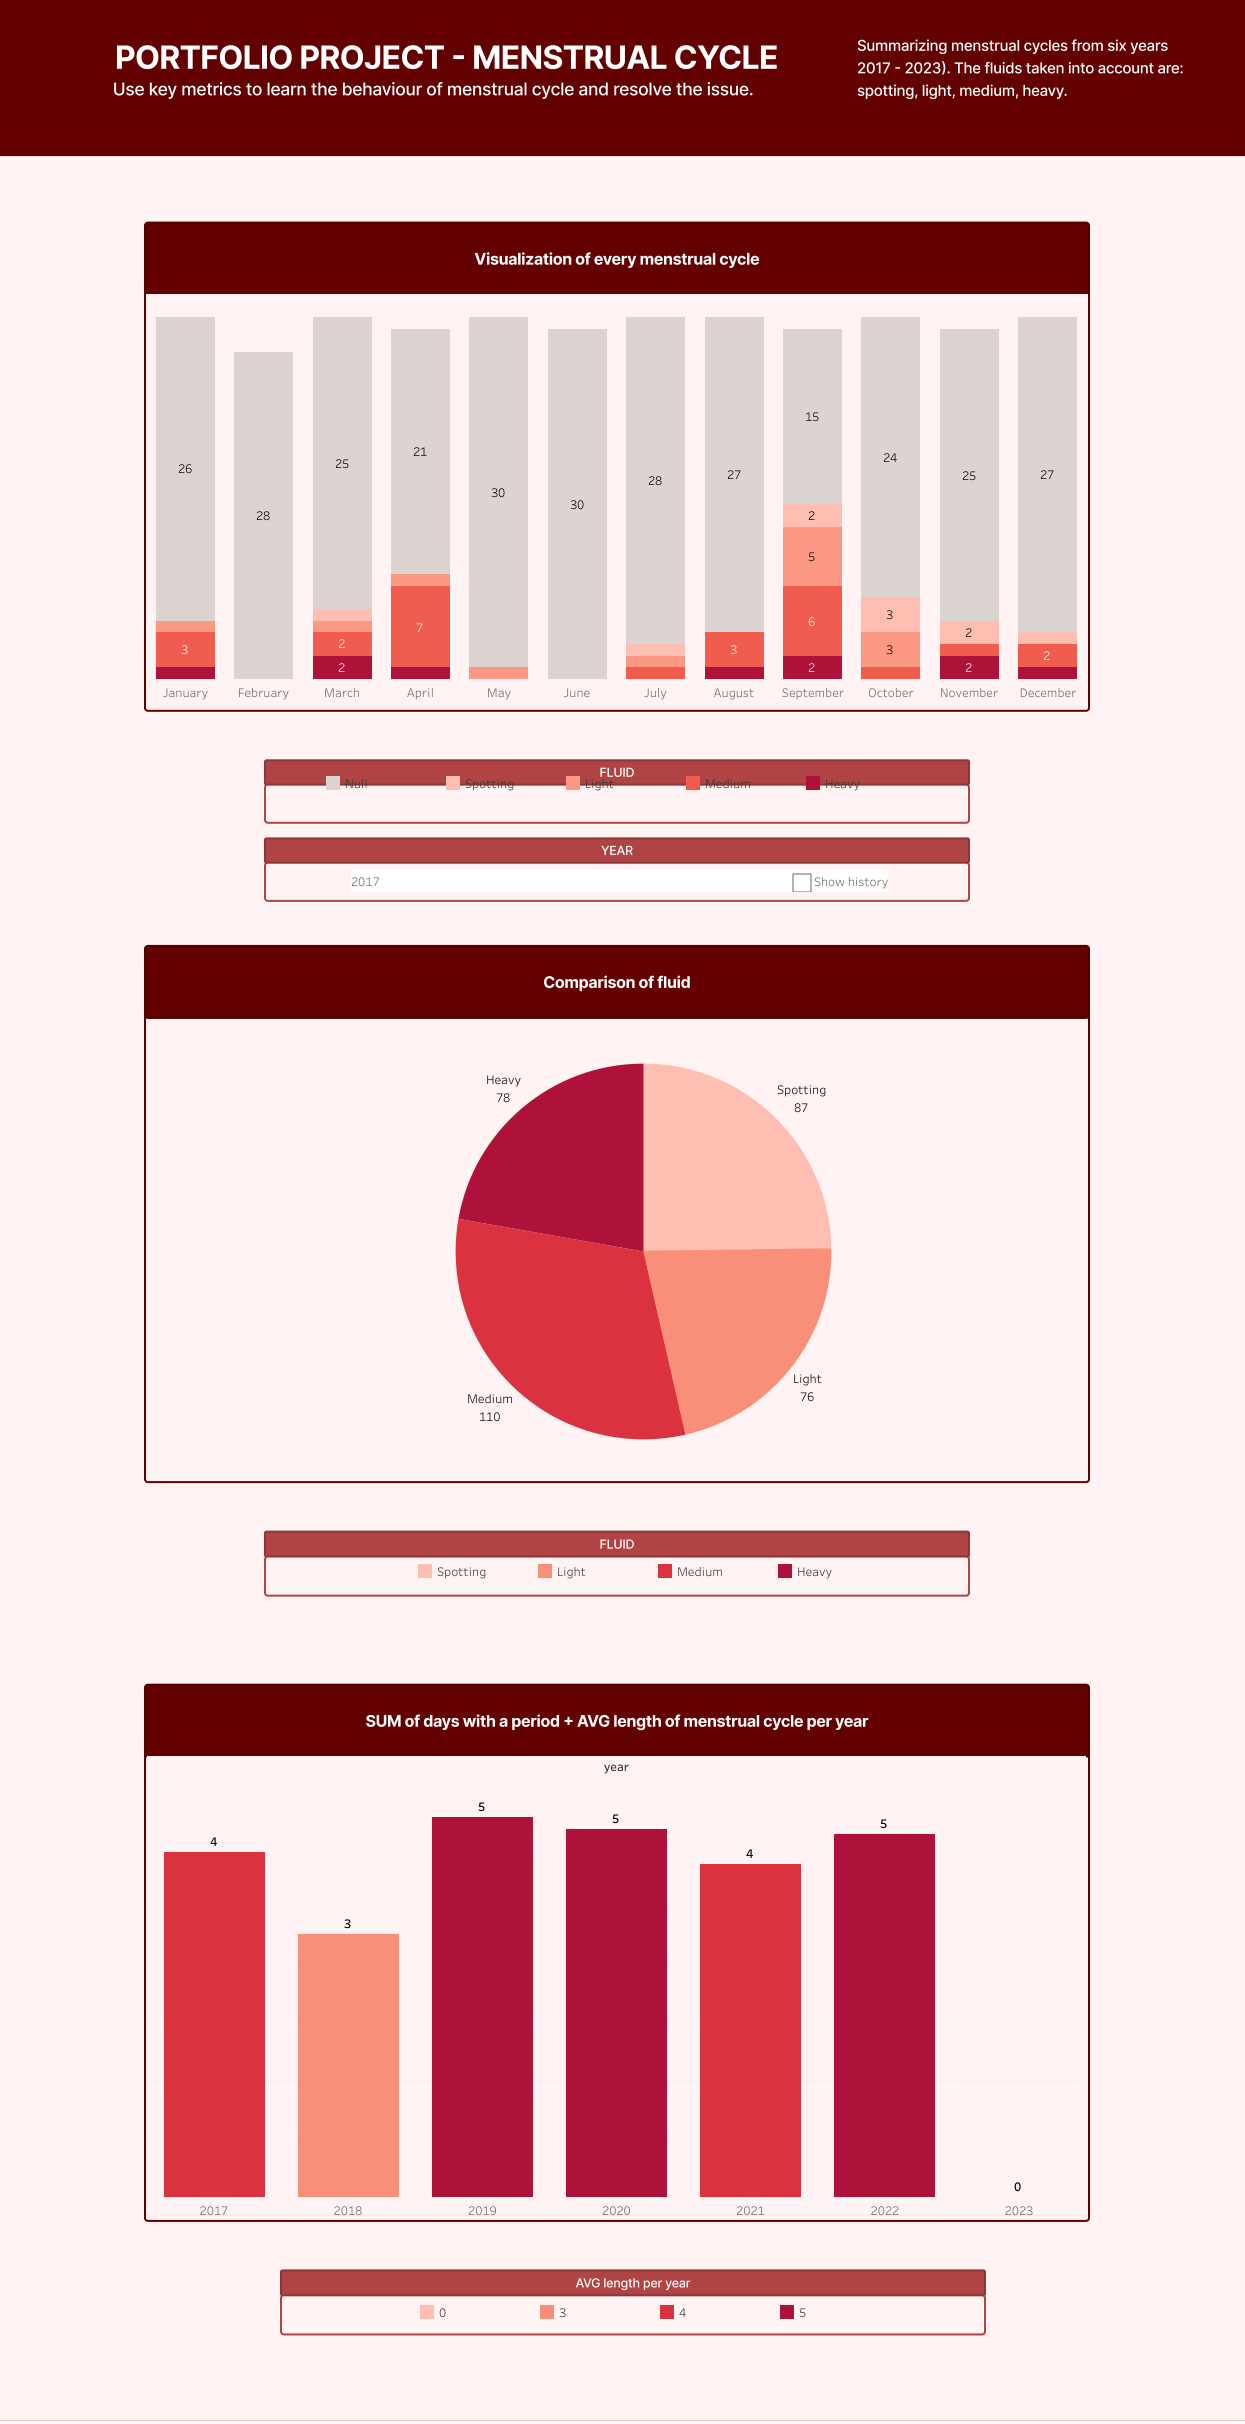
Menstrual Cycle
Analysis on my own menstrual cycles from 2017 to 2023 as a goal to know how consistent my periods are and take medical actions towards it.
Tools: Excel, Sql, Tableau
Project on Tableau HERE
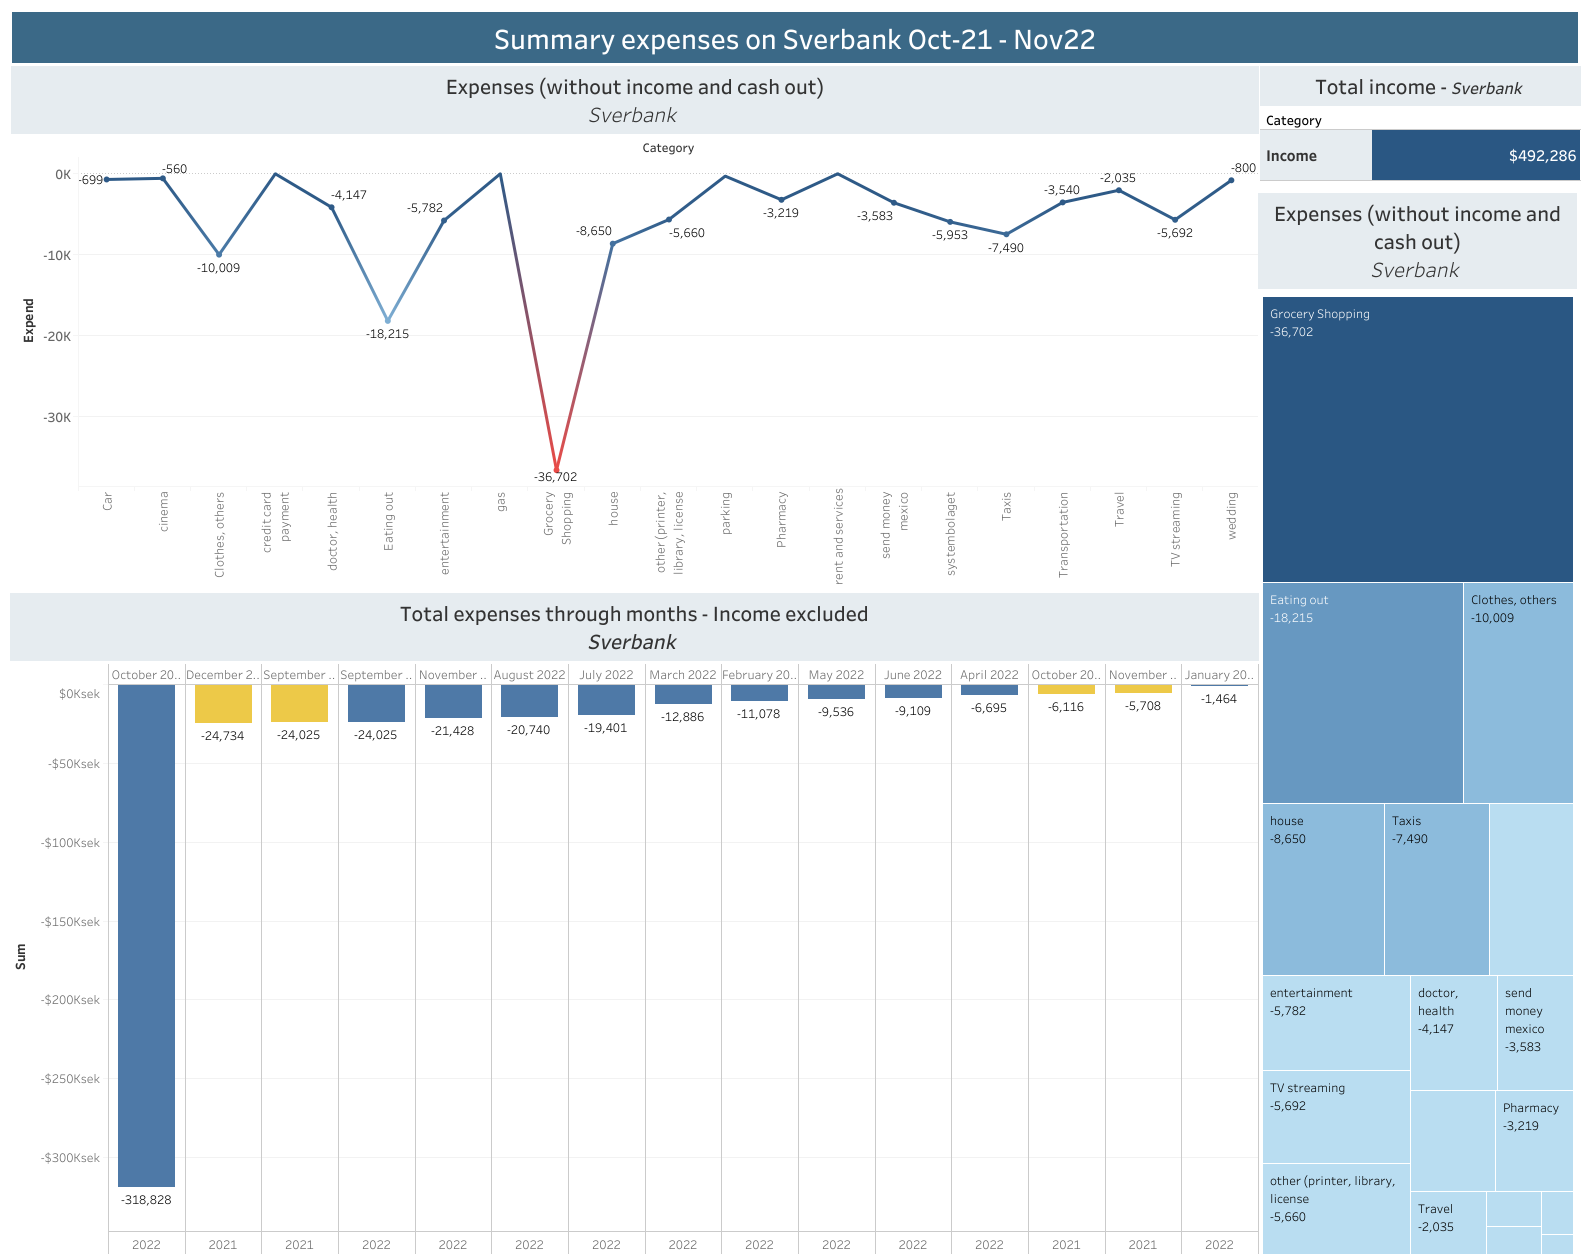
Personal Expenses
Analysis on a client's personal expenses who wish to track a part of the expenses in order to take better financial decisions.
Tools: Excel, Sql, Tableau
Project on Tableau HERE
DVD-rental store
Analysis on a DVD rental store to answer questions regading customer, rentals, location of customers, popularity of products, etc.
Tools: Excel, Sql, Tableau
Project on Tableau HERE
Projects sql

All projects on Github HERE
Cleaning data in SQL
Cleaning data in SQL using: Joins, Strings, Partition, Substring, Pasername, Case Statements, CTE.
Tools: SQL
Queries on Github HERE
Covid-19 Analysis
Analysis on covid-19 from the beginning until March'21. This dataset focuses on deaths, vaccinations and specific countries such as United States, Sweden and Mexico.
Tools: Excel, Sql, Tableau
Queries on Github HERE
Most sold video-games globally
Analysis on the Top 43 most sold video games softwares. This dataset shows sales, years, publishers, developers, among other information.
Tools: Excel, Sql, Tableau
Queries on Github HERE
Menstrual Cycle
Analysis on my own menstrual cycles from 2017 to 2023 as a goal to know how consistent my periods are and take medical actions towards it.
Tools: Excel, Sql, Tableau
Queries on Github HERE
Personal Expenses
Analysis on a client's personal expenses who wish to track a part of the expenses in order to take better financial decisions.
Tools: Excel, Sql, Tableau
Queries on Github HERE
DVD-rental store
Analysis on a DVD rental store to answer questions regading customer, rentals, location of customers, popularity of products, etc.
Tools: Excel, Sql, Tableau
Queries on Github HERE
Projects EXCEL

PivotTable in Excel
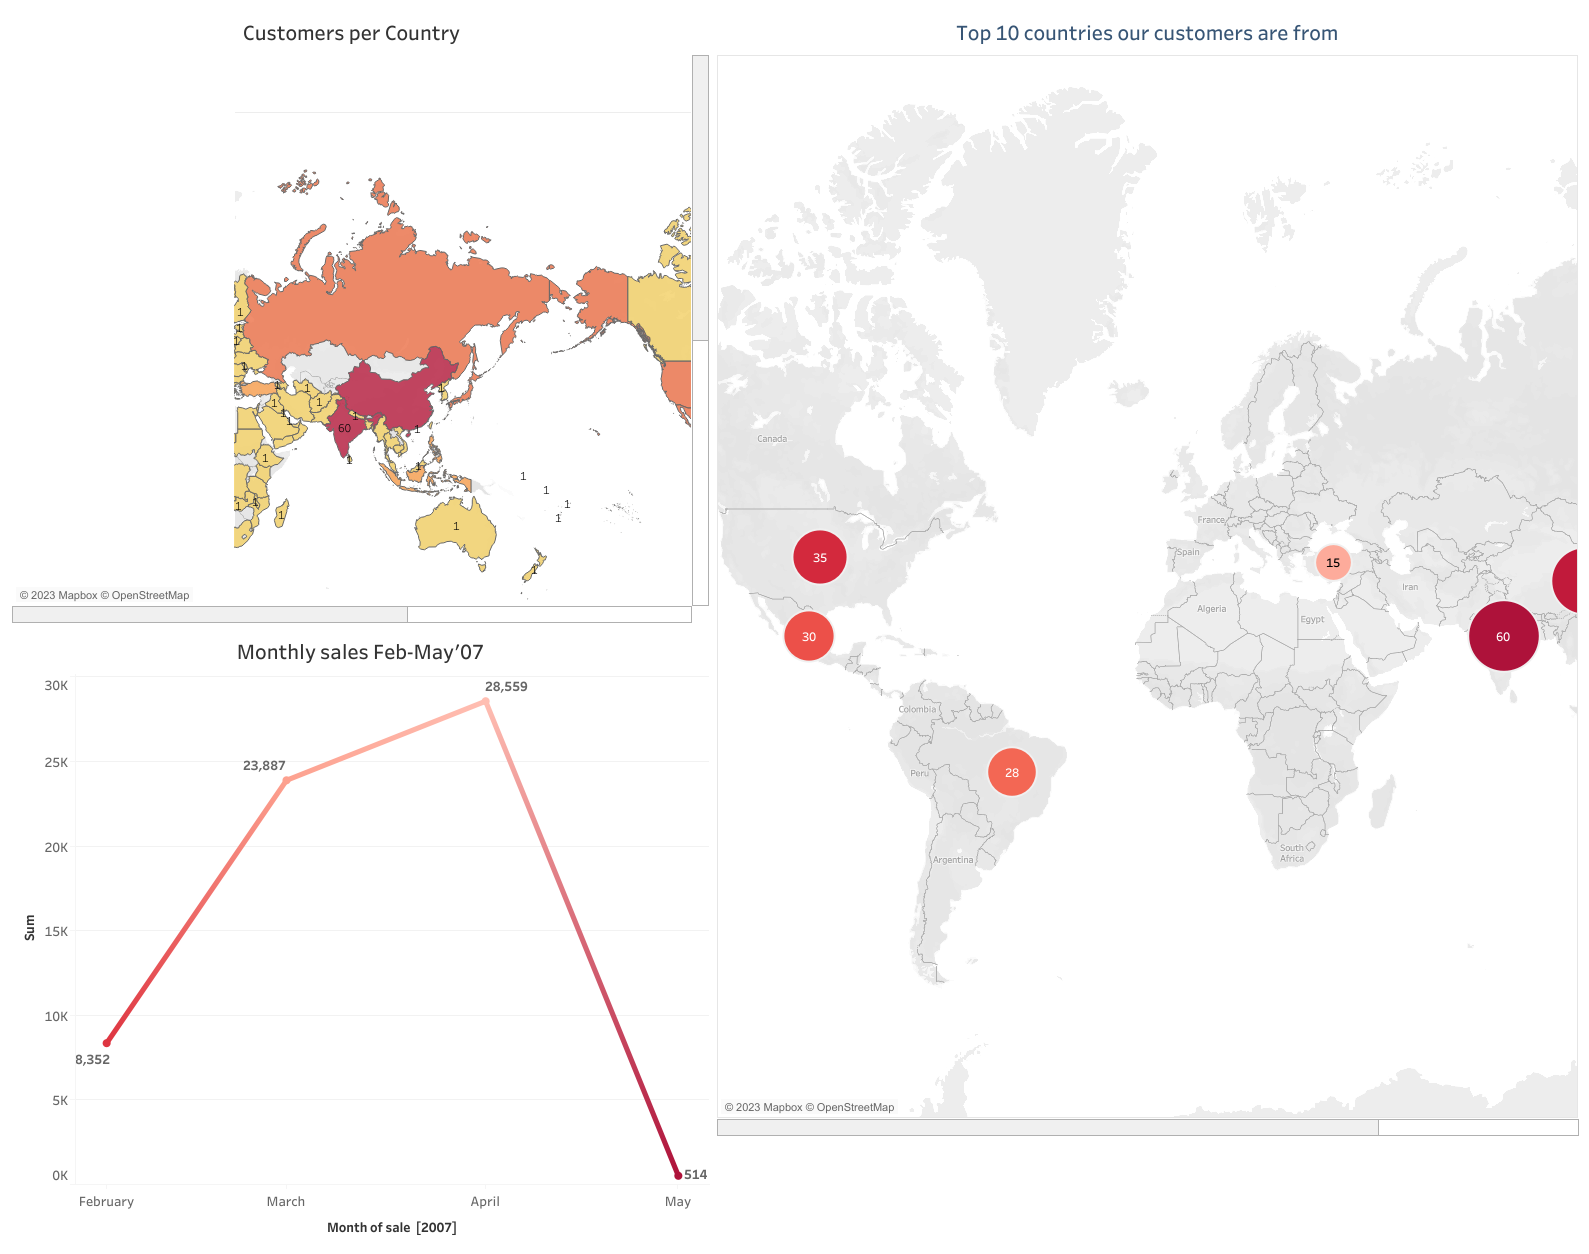
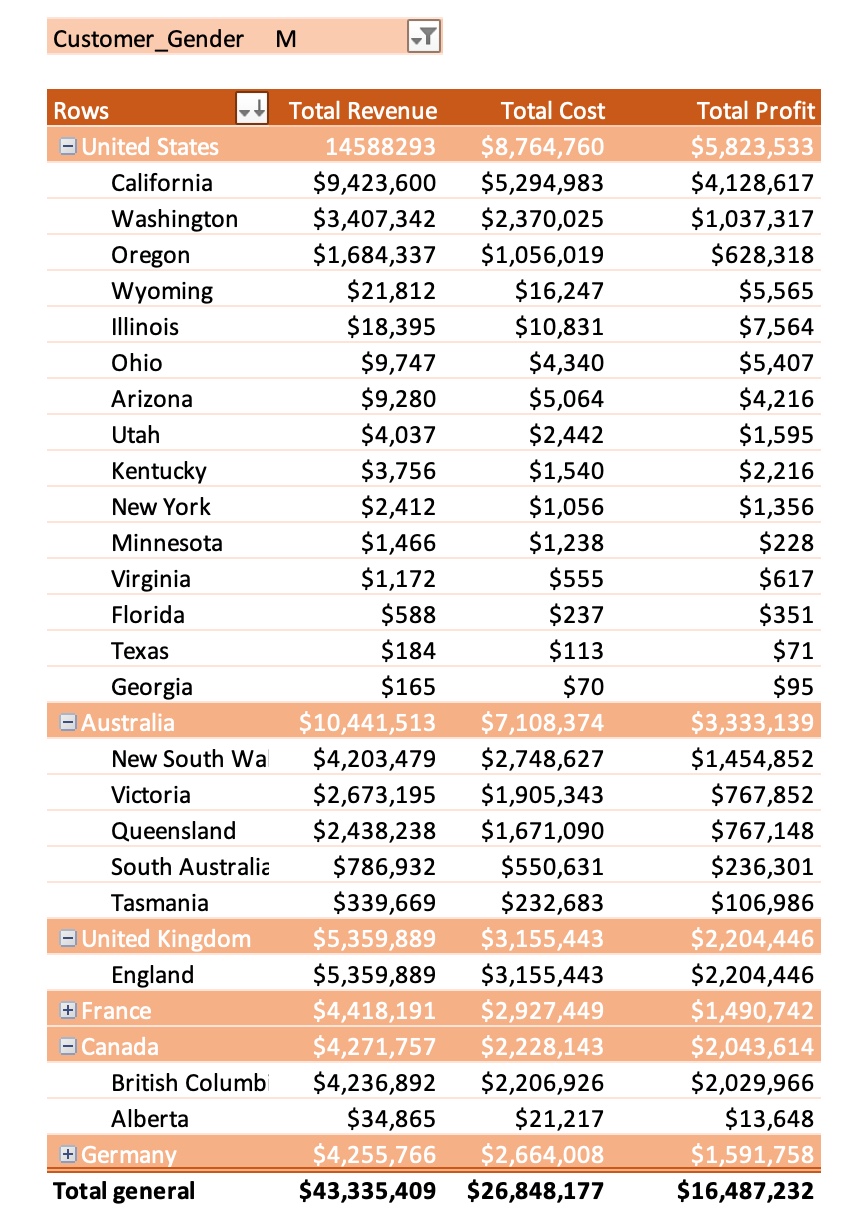
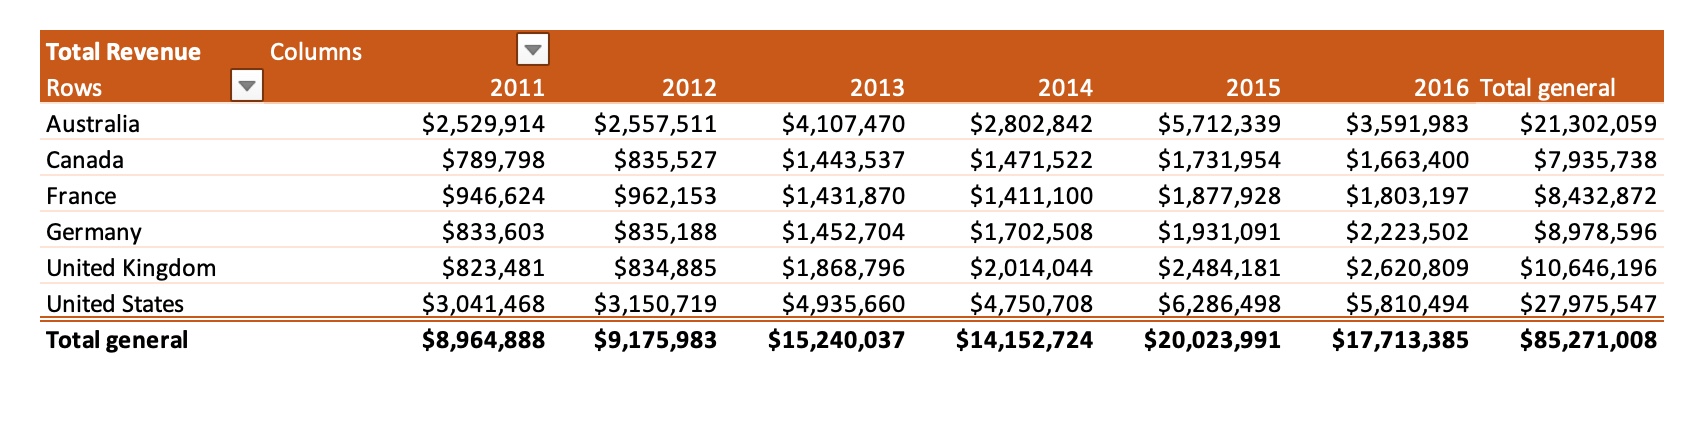
This project shows bike sales in United States, Australia, UK, France, Germany and Canada.
Creation of PivotTables with more than 113,000 to show the total of sales per country and subsequently per city. It shows the total
revenue, total cost and total profit. Filter it by 2 genders, female and male.
Calculated fields were created to make sure that the automatic calculations on excel were adding up correctly.
Subsequently, a second pivot table was created in order to see which year/time we were doing our best sales.
Tools: Excel
Document on Github HERE
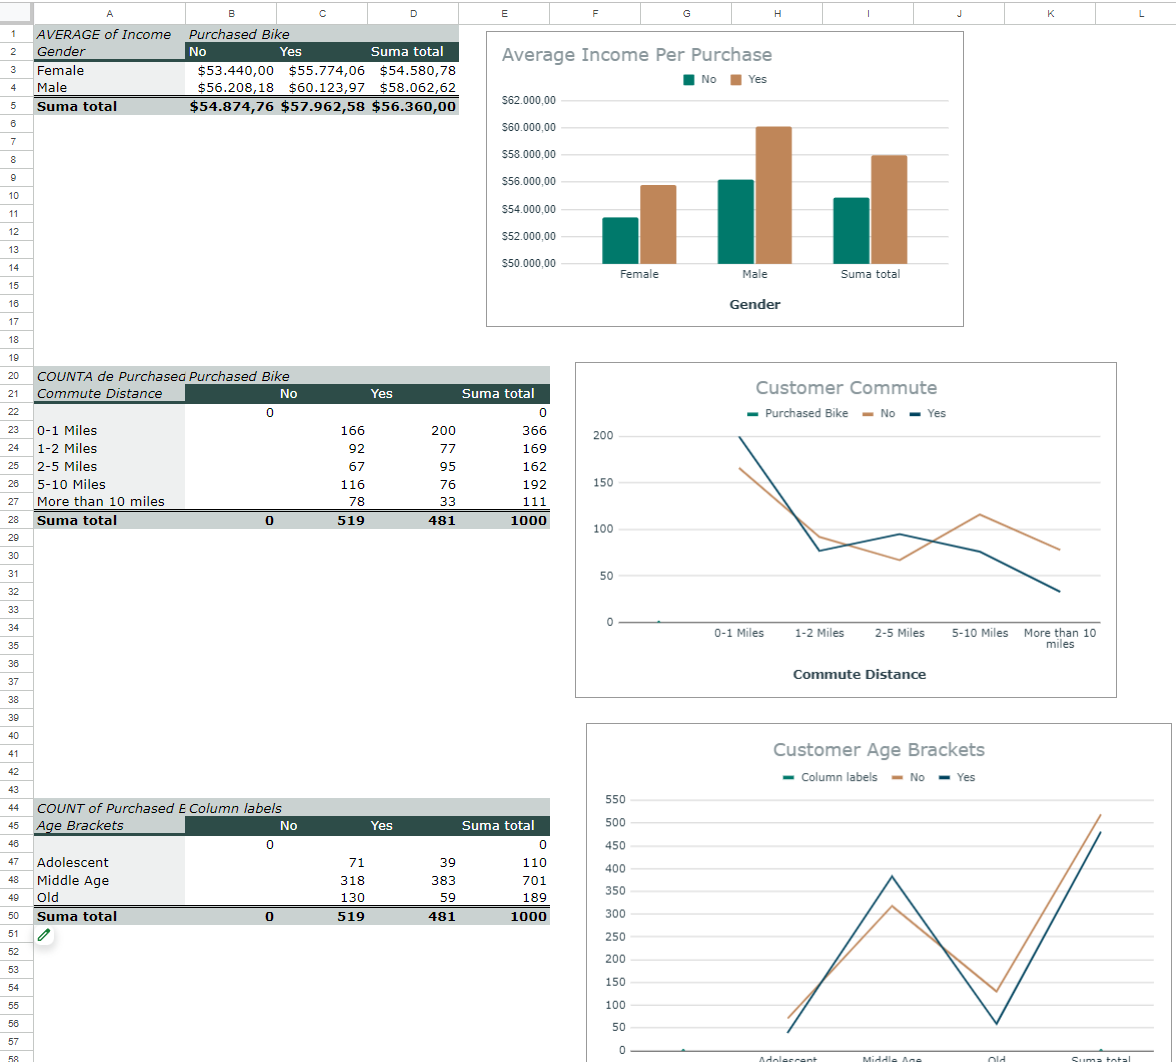
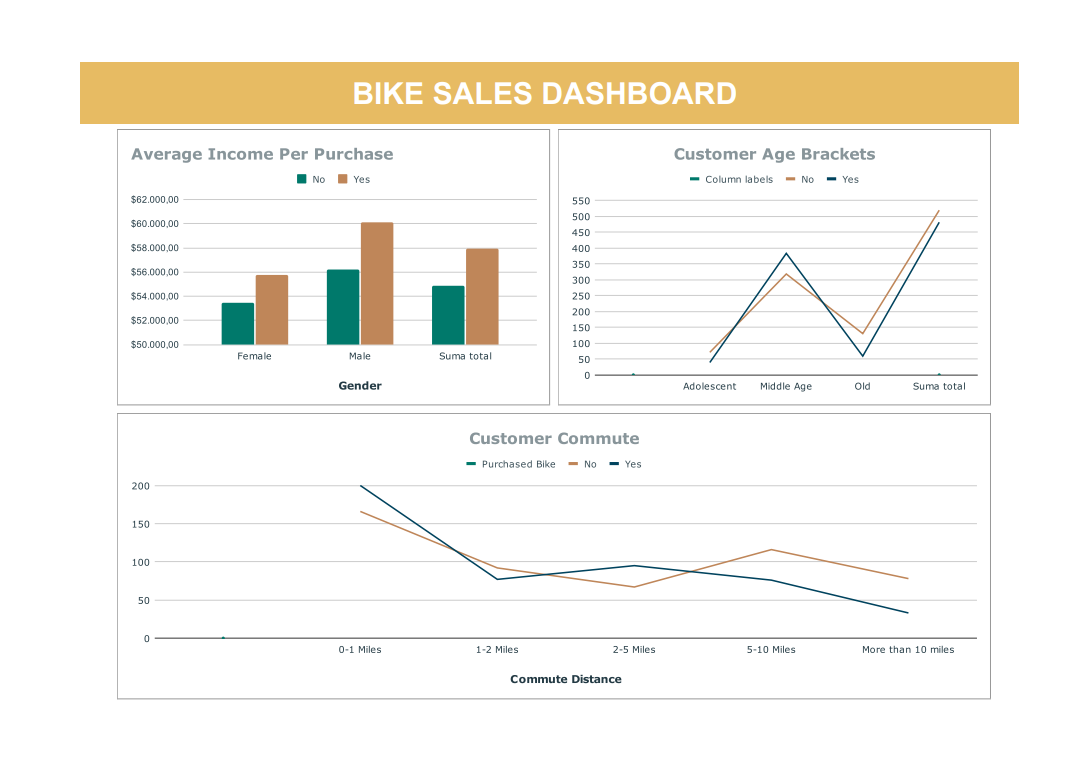
Dashboard in Excel
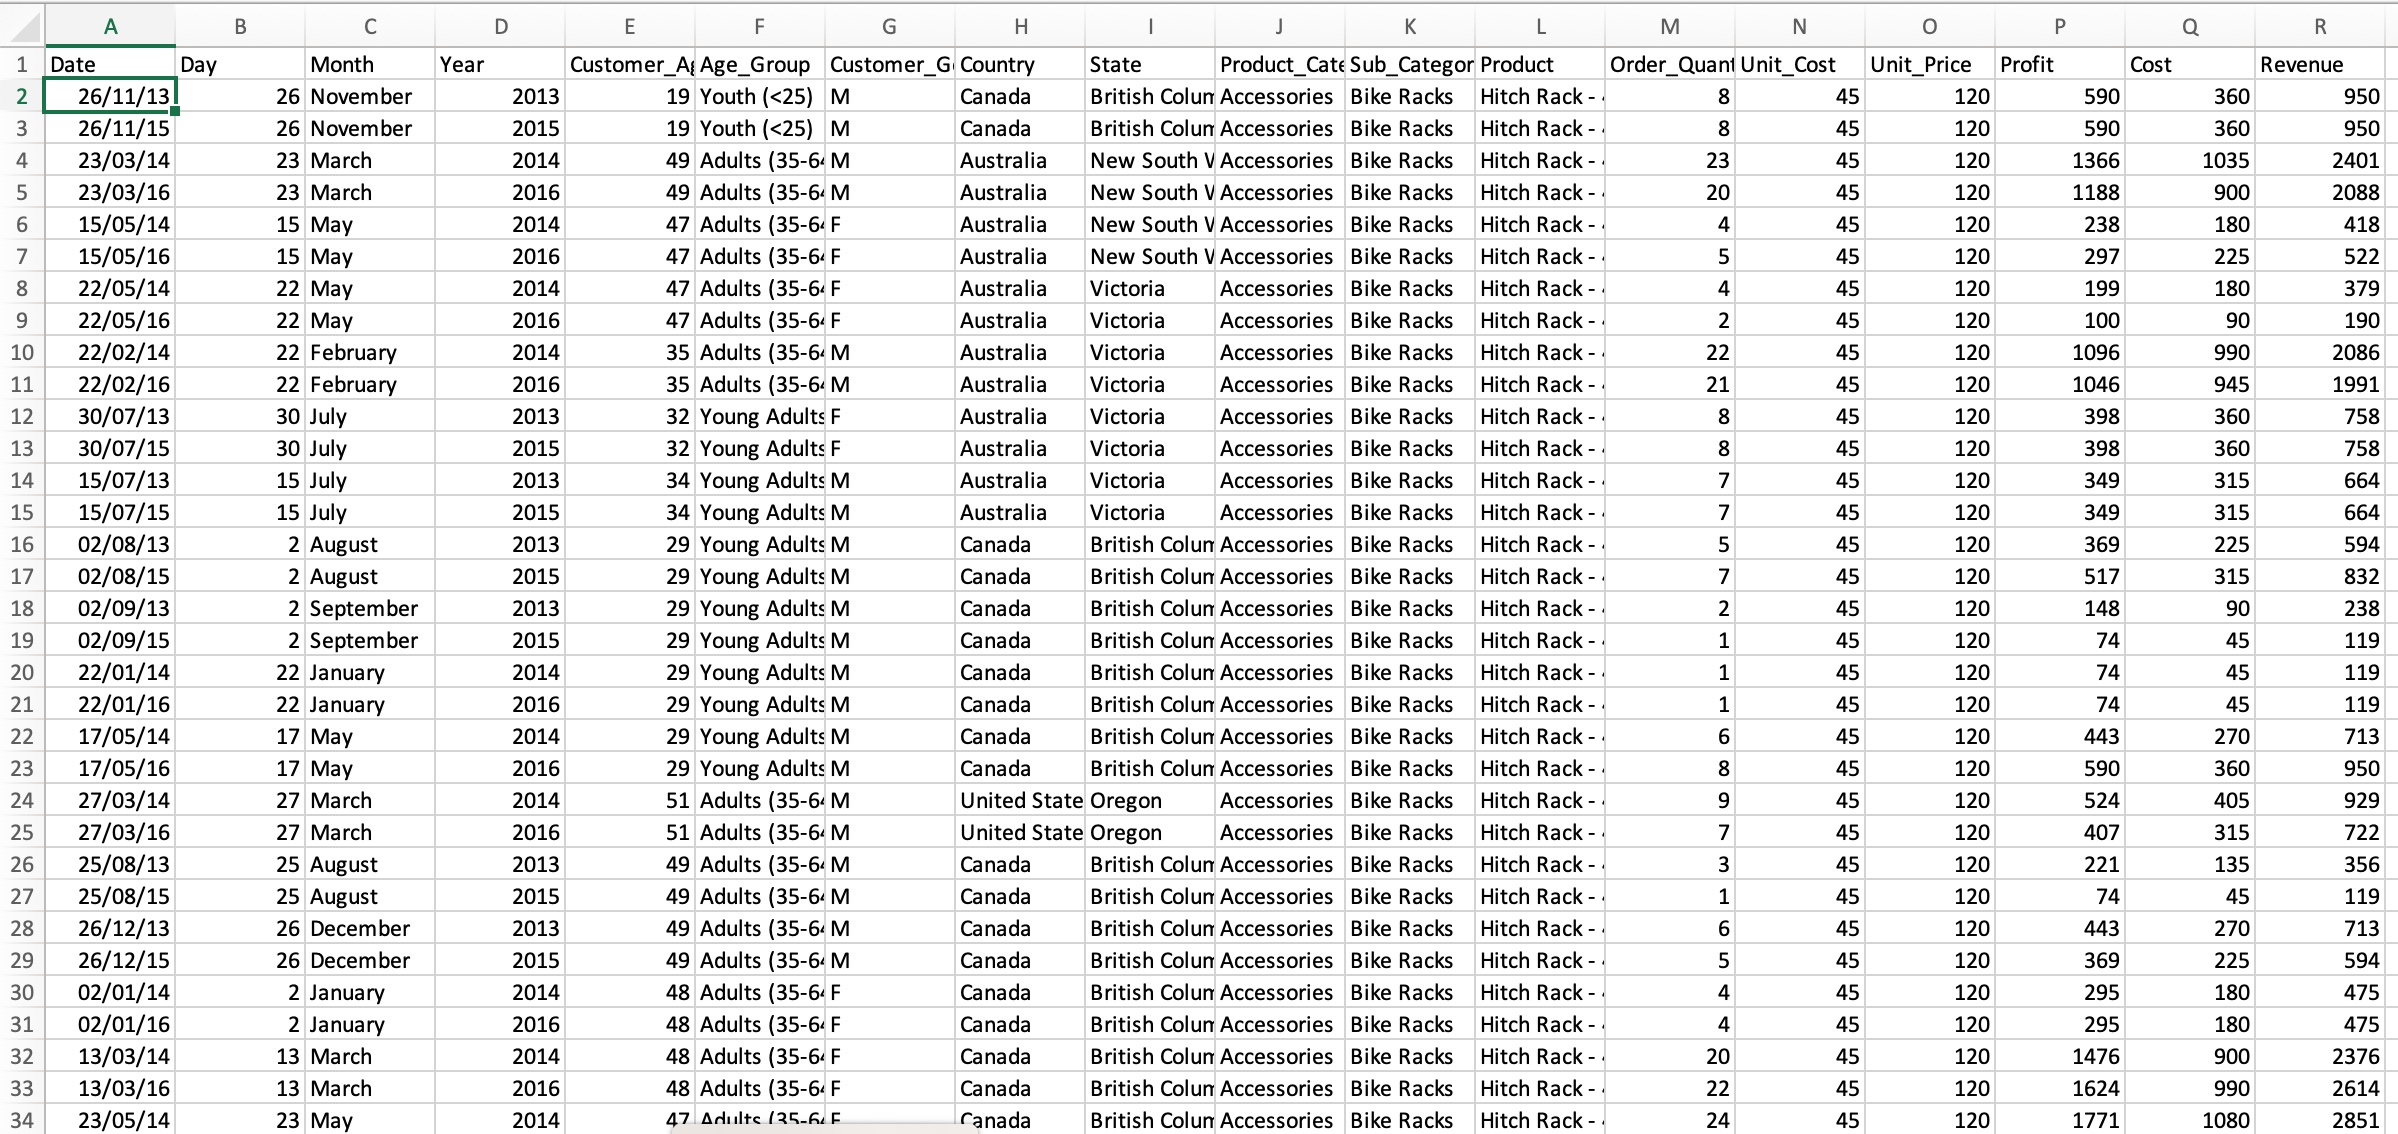
This project is about the data cleaning process in Excel and creating a dashboard in Excel using pivot tables. I cleaned the data,
removed duplicates, changed certain information so it was user/friendly and made a visualization.
Tools: Excel
Document on Github HERE
Elements
Text
This is bold and this is strong. This is italic and this is emphasized.
This is superscript text and this is subscript text.
This is underlined and this is code: for (;;) { ... }. Finally, this is a link.
Heading Level 2
Heading Level 3
Heading Level 4
Heading Level 5
Heading Level 6
Blockquote
Fringilla nisl. Donec accumsan interdum nisi, quis tincidunt felis sagittis eget tempus euismod. Vestibulum ante ipsum primis in faucibus vestibulum. Blandit adipiscing eu felis iaculis volutpat ac adipiscing accumsan faucibus. Vestibulum ante ipsum primis in faucibus lorem ipsum dolor sit amet nullam adipiscing eu felis.
Preformatted
i = 0;

while (!deck.isInOrder()) {
    print 'Iteration ' + i;
    deck.shuffle();
    i++;
}

print 'It took ' + i + ' iterations to sort the deck.';
Lists
Unordered
- Dolor pulvinar etiam.
- Sagittis adipiscing.
- Felis enim feugiat.
Alternate
- Dolor pulvinar etiam.
- Sagittis adipiscing.
- Felis enim feugiat.
Ordered
- Dolor pulvinar etiam.
- Etiam vel felis viverra.
- Felis enim feugiat.
- Dolor pulvinar etiam.
- Etiam vel felis lorem.
- Felis enim et feugiat.
Icons
Actions
Table
Default
| Name |
Description |
Price |
| Item One |
Ante turpis integer aliquet porttitor. |
29.99 |
| Item Two |
Vis ac commodo adipiscing arcu aliquet. |
19.99 |
| Item Three |
Morbi faucibus arcu accumsan lorem. |
29.99 |
| Item Four |
Vitae integer tempus condimentum. |
19.99 |
| Item Five |
Ante turpis integer aliquet porttitor. |
29.99 |
|
100.00 |
Alternate
| Name |
Description |
Price |
| Item One |
Ante turpis integer aliquet porttitor. |
29.99 |
| Item Two |
Vis ac commodo adipiscing arcu aliquet. |
19.99 |
| Item Three |
Morbi faucibus arcu accumsan lorem. |
29.99 |
| Item Four |
Vitae integer tempus condimentum. |
19.99 |
| Item Five |
Ante turpis integer aliquet porttitor. |
29.99 |
|
100.00 |